

Foggy days ahead, traffic cops place tapes, rumble strips at sharp turns
- Tuesday | 12th December, 2023
Vote for BJP in urban local bodies" poll for "triple engine" govt in UP: Adityanath
UP: Man booked for attempting to rape 5-year-old girl
Congress to mark 100 days of Bharat Jodo Yatra with concert in Jaipur
BJYM, Hindu outfits put off planned protest march at AMU
Karachi battles gas crisis; residents face unannounced load shedding, 2-hr gas supply in a day
Elderly man in judicial custody dies during treatment in UP hospital
Himachal Pradesh skittle Haryana for 46, take 200-run lead on Day 1
Pak court grants protective bail to PM Shehbaz"s son Suleman in money laundering case
British Library celebrates India ties with exhibition on Hampi
Nine policemen suspended after suspect dies in police custody in UP
Gangster"s property attached in UP"s Pratapgarh district
Maoists torch construction company vehicles in Jharkhand’s Chatra district
Sino-India border situation "generally stable": China on Yangtse clash
Babar Azam not taking advice from seniors, claims Shahid Afridi
Qlite Global launches their exclusive Grand Experience Centre
"Disillusioned with central leadership": Sikkim BJP president says he has resigned
2001 attack anniversary: Ready to guard new Parliament if directed, say CRPF heroes
Class 2 student dies after scuffle with fellow students in UP
Three killed in accident in UP"s Lakhimpur KheriLakhimpur Kheri (UP), Dec 13 (PTI) Three motorcycle borne youths were killed and "
Abandoned girl child from Assam adopted by Spanish professor
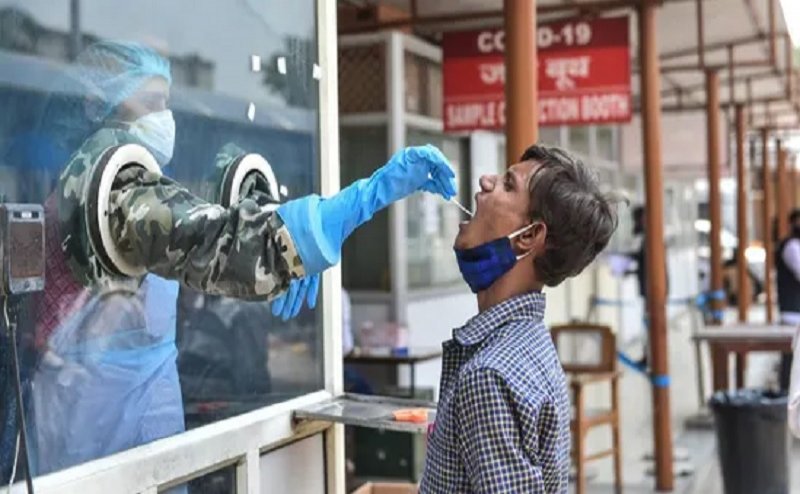
Lucknow: Have states been testing enough to curb the spread of the second wave of Covid-19 in India? An HT analysis suggests that while current positivity rates are high enough across states to require increased testing, a low positivity rate earlier, or when it comes in the future, may not always be a wholesome indicator of adequate testing (not unless it comes after a long plateau or a gradual decline).
Lucknow: Have states been testing enough to curb the spread of the second wave of Covid-19 in India? An HT analysis suggests that while current positivity rates are high enough across states to require increased testing, a low positivity rate earlier, or when it comes in the future, may not always be a wholesome indicator of adequate testing (not unless it comes after a long plateau or a gradual decline).
The World Health Organisation (WHO) considers a prolonged positivity rate of under 5% to be the threshold at which the Covid-19 infections in an area can be said to be under control. No major state in India had a positivity rate of 5% or less on average in the week ending May 4. This underlines the need for all states to test more.
However, four weeks ago, five of India’s 19 major states had an average positivity rate less than 5%. These were — in increasing order of positivity rates — Assam, Telangana, Bihar, Gujarat and Odisha. The state that came next was Uttar Pradesh, with a positivity rate of 5.8%. This is at odds with anecdotal reports from the state at the time that spoke of people finding it difficult to get tested. At 13.2%, even in the week ending May 4, the average positivity rate in the state was lower compared to most states: it was, in fact, the fifth lowest among 19 major states. Why have official numbers from the state not reflected what ground reports suggest? (See maps)
One reason for UP’s official numbers showing testing as adequate despite ground reports suggesting otherwise could be that the large-scale testing is limited to a few areas, cities, or districts. Checking positivity rate at district-level could possibly help confirm this distribution of tests, not only in Uttar Pradesh, but other states that have shown low positivity rates even amidst reports of oxygen shortage, space crunch in hospitals, crematoriums, and graveyards.
However, only a few states — Rajasthan, Punjab, Gujarat, Uttarakhand, Himachal Pradesh, Tripura, and Arunachal Pradesh — publish district-level testing or positivity rates, and most major states with low positivity rates are not among them. What we have at the district level for all major states is the number of Covid-19 cases.
But these case numbers can be used as a proxy to test for adequacy of testing. For instance, if a district has a high number of cases per million population, it is evident that the infection is widespread in that district. It is reasonable to assume that adjacent districts will be affected by high rates of infection as well (especially if the first district is a hub of sorts). To check for this trend on a map, HT created a map of average cases per million by districts in the last week, normalised on a scale of 0 to 1 for districts of each state. A district with a score of 1 has the highest cases per million in the state, and the district with a score of 0 has the lowest cases per million in the state.
HT plotted four such maps: showing this index for the week ending April 13, April 20, April 27, and May 4. Rather satisfyingly, data from most states support the premise that adjacent districts have similar caseloads theory throughout this period. Uttar Pradesh alone looks like an outlier in April, with districts around Lucknow having a far lower score than it. This means that while Lucknow had the highest infection rates in Uttar Pradesh through April, districts around it remained largely unaffected. That, as maps of other states suggest, is not credible unless there was no movement from Lucknow to adjoining districts, or unless testing in neighbouring districts was inadequate. That the state was holding Panchayat polls during this period makes this even more unlikely. (See maps)
To be sure, this trend can also be seen in the union territory or Ladakh and some north-eastern states. In Ladakh, this trend is a mathematical quirk. If there are just two districts in a state, one of them will have the highest cases per million (and therefore a normalised score of 1) and other minimum (normalised score of 0). In districts in the north-eastern states, the absolute infection rates themselves are far lower than Lucknow, which might explain the infection not spreading to neighbouring districts as readily. In the week ending April 27, for example, West Tripura had an average of 49 cases per million compared to 1,137 per million in Lucknow.
Your support to NYOOOZ will help us to continue create and publish news for and from smaller cities, which also need equal voice as much as citizens living in bigger cities have through mainstream media organizations.